| | 85% of all doctors queried get the wrong answer to the following problem:
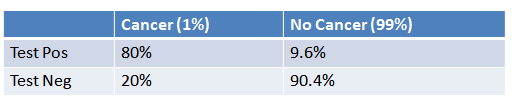
1% of women at age forty who participate in routine screening have breast cancer. 80% of women with breast cancer will get positive mammographies. 9.6% of women without breast cancer will also get positive mammographies. A woman in this age group had a positive mammography in a routine screening. What is the probability that she actually has breast cancer?
Why do 85% of these doctors think the answer is somewhere in the 70% - 80% range?
First of all, nobody likes math story problems. I have a bad early memory from high school algebra of trying to solve a certain story problem where I did not know (at the time) what a "cross-section" was. Story problems can be pretty sinister even when they aren't trying to be.
I did have a good algebra teacher who taught us the steps to use in solving story problems. And this I haven't forgotten. So in first viewing the breast cancer problem my natural inclination was not to juggle the numbers (...damned lies and statistics) in order to derive a quick and easy solution. My first inclination was to treat it just as it is - as a story problem.
In this, I did not assume the answer was close to 80%. Nor did I assume the answer was close to 1%. In fact, I did not assume anything, but only set out to solve, methodically, the riddle before me.
This is analogous to the string-method of measuring used by day-laborers. In order to get a more precise measurement, laborers do not use a ruler or a tape measure, they do not use anything with markings on it because this tends to bias the result as the markings force them to round to the nearest number. Laborers can actually get a more precise measurement by using a plain piece of string.
By ignoring all previous biases ("priors") in the problem, by simply using a "piece of string," I set forth simply to tackle the thing using a story problem solving method.
After I derived the answer (which was happily the correct one) I looked at the webpage and found a similar method had been employed there. They used a 4-square box filled with real numbers, not percentages, just like I had done, to give the problem some reality. The only real difference was that I had started with a sample of 1,000 women but soon decided 10,000 would give better figures to deal with.
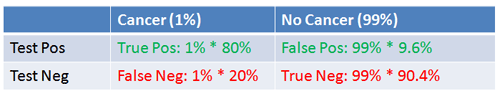
The first thing you'll find is that only 100 women out of 10,000 in the study had cancer. Then you'll find that 80 of those 100 will be true positives. 9.6%, or 950.4, had false positives.
We could go further to derive more "real" numbers (as I did the first time around), but these are sufficient. We want the probability of finding a true positive based on a positive test result. So all we have left to do is add the positives (950.4 and 80 = 1030.4), then divide 80 by the result. There are 80 cancer victims out of 1030.4 positive test results. Therefore, 80/1030.4 = 7.76%.
QED
(Edited by Robert Keele on 1/19, 3:42pm)
|
|


